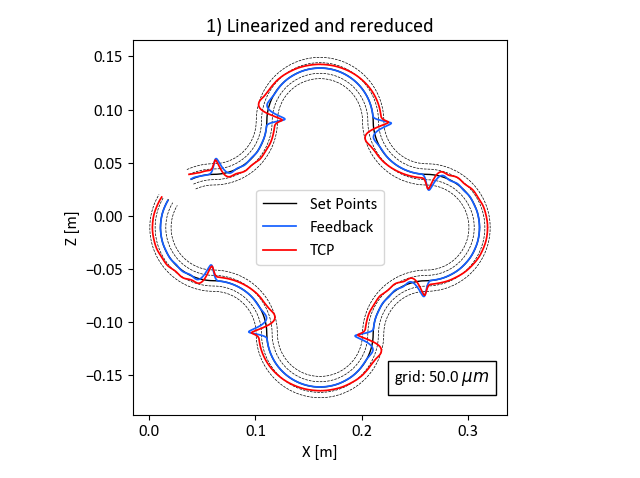
In MORe 4.0 Ftan, two new relevant features were implemented. While rereduction can speed up the simulation time by a factor of 10, non-linear link properties can be used to simulate friction effects. In this article, we want to introduce both of these features in a combined example.
Model setup
For this case, the RMT MORe model is used. It is a 3-axis machine tool model with three linear drives in X-, Y- and Z-direction.The model is fully defined by means of mechanical, thermal and thermo-mechanical properties and is frequently used in our courses to teach you the capabilities of MORe.

Problem statement
We want to simulate the influence of the kinetic friction in the link between the rails and the carriages. Furthermore, a calculation speed comparison between the following four analysis settings is performed.
- Linearised and rereduced
- Linearised
- Rereduced
- Neither rereduced nor linearised
Rereduction and non-linear link properties
Rereduction
Model order rereduction is a specific feature of MORe. It allows MORe to perform the analyses faster by eliminating parametric dependencies. This removes unused information of moving interfaces for a specific position of the components, which has a huge impact on the performance if many moving interfaces are present in the model.
Non-linear link properties
We restructured the way of defining link properties. As of the release MORe 4.0 Ftan, link properties can depend on the state of the link, i.e. displacement and velocity. We added kinetic friction as first non-linear link property. Kinetic friction occurs when two objects are moving relative to each other and rub together.
Linearisation
Non-linear link properties, such as kinetic friction, increase the complexity of the equations that are solved for the simulation by quite a bit. If you are not interested in the non-linear effects for a particular analysis, MORe can linearise the system of equations and thus give you much faster calculation speeds.
Speed comparison
We run the simulation with four different setups, namely non-linear link properties (reduced and rereduced) and linearised link properties (reduced and rereduced). The resulting performance of the model is the following.
Linearised
Non-linear
Rereduced
Reduced
Rereduced
Reduced
Simulation time
44.56s
433.15s
1166.49s
1643.10s
Rereduction speed-up factor
10
1.4
For the linearised system, the speed up factor using rereduction is 10 compared to the reduced system. In the non-linear case, the speed up factor is 1.4.
When should you use linearisation
Non-linear link properties can only be considered in transient analyses, so for all other analysis types you don’t have to bother with that decision. If the model is linearised, non-linear link properties, i.e. kinetic friction, are not considered, but in exchange the simulaiton runs much quicker. We recommend using linearised simulations until you are satisfied with the analsis setup and then carry out a final run with linearisation disabled.
Trade-offs for linearisation:
+ Speed up factor of around 4
– Non-linear link properties not considered
When should you use rereduction
Rereduction eliminates the parametric dependencies of the model. For the mechanical model this means that the moving interfaces are fixed at their current position. This allows for further reduction of the degrees of freedom of the model without compromising the result accuracy but at the cost of the model being only valid for one configuration of the axes at a particular position. Furthermore, no profile evaluations can be performed in the post processor, since we discarded all the information about the moving interfaces.
Rereducing the systems results in a large performance boost for analyses, which repeatedly evaluate the model at the same configuration of the axes at a particular position (frequency response analysis, transient analysis). Therefore, we recommend to keep it enabled, unless you want to use a profile evaluation in the post processor.
Trade-offs for rereduction:
+ Speed up factor up to 10
– No profile evaluation in the post processor possible
Simulation results
The following section shows the contour error plots for the results of the four transient simulation results. They show the setpoints of the controllers in black, the feedback of the control loop (measuring system) in blue and response of the tool centre point (TCP) relative to the workpiece in red.


The following conclusions can be drawn.
- The difference between linearised and non-linear simulation is apparent. The friction effect can be seen in the figures 3) and 4) at the outer curves, where the axes have to change the direction of movement.
- The rereduction (compare figure 1) and 2) or 3) and 4) only affects the simulation speed. As long as the axes positions are not changed during simulation and there is no interest in profile evaluation, this feature can be used to save precious time.
- “But the axes are clearly moving in this case, why is there no difference with rereduction?” Well, for the transient analysis that is currently implemented in MORe, the model is only assembled once at the initial configuration of axes positions. At runtime of the simulation, the model is not updated to reflect the change of the force application on the moving interface. As long as only small axis movements occur during simulation, the resulting error is negligible. But if a trajectory spans a significant part of the working space, this simplification can have a remarkable impact.
In addition, the MORe postprocessor can export clips of the simulation results. The animation below shows the setpoints and the resulting relative deviation of the tool centre point to the workpiece for the transient simulation without linearisation nor rereduction (where the error is scaled by a factor of 100).


