MORe is not only efficient when it comes to analyzing the design and performance of machine tools. The postprocessor makes the presentation of the simulation results easy and fast. In the following post, we will guide you through the different possibilities that the postprocessor offers.
Model setup
This feature presentation uses the results of the blog post Welcome to the world of thermo-mechanical simulations: environmental temperature effects. The machine tool used for this post is the RMT, a 3-axis machine tool with linear direct drives. The thermo-mechanical model represents a drop of the environmental temperature while the temperature of the structural cooling is constant.
Postprocessor
Structure
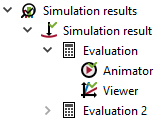
Let’s start with a quick summary of the postprocessor structure. For every simulation you run, a simulation result will be created. These simulation results contain evaluations. The evaluations allow the user to handle the results in different ways. Additionally, the evaluations contain viewers. The viewers perform the data visualization, enabling the user to show and animate the simulation results.
Basics
You just finished a thermo-mechanical analysis evaluating the effect of an environmental temperature drop on a machine tool. As always, time is precious and you would like to visualize the output of the model as fast and clearly as possible. Let’s say you are interested in displaying the deviations between the tool center point (TCP) and the workpiece in X-, Y- and Z-direction. The postprocessor in MORe makes it straightforward. All you have to do is to add a figure viewer, select the desired link (TCP) as well as the corresponding degrees of freedom (‘u’,’v’ and ‘w’) and you get the plot directly in the viewer of the postprocessor. If you are not happy with the default presentation of the results in the plot you are completely free to change almost everything, such as scaling the data, selecting between a linear or logarithmic plot, line style, or color and changing the labels, in no time. You can take advantage of all the options to create a customized plot ready to use for reports and presentations in your company.

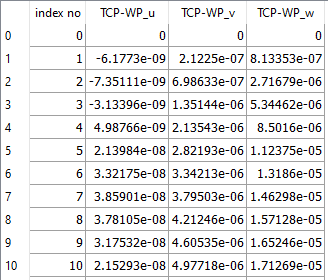
Sometimes it might be useful to visualize directly the numerical data creating a table. You can generate tables in the same straightforward way you create a plot. The only thing you need to define is the output-link (TCP) and the desired degrees of freedom (‘u’, ‘v’ and ‘w’) and the viewer shows you the results as a table. The tabular viewer also offers customization options, such as defining custom labels or scaling the data.
Advanced
It is pleasant to have a software that not only simulates the behavior of machine tools efficiently but also facilitates the presentation of the results. Showing simulation results in a plot or a table is a standard feature in many simulation software tools. However, looking at some lines or a table might be too cryptic to interpret the results of complex simulations. Therefore, MORe provides the possibility to animate the results of every analysis in 3D. The animators in MORe are powered by state-of-the-art 3D visualization tools, enabling you to interact seamlessly with the simulation results.
The possibility to visualize the structural deformation or temperature field in 3D might not be such a striking feature. If you are used to working the commercial finite element (FE) software, you have already experienced the joy of colorful 3D animations. However, let’s not forget that MORe uses efficient reduced-order models. This means that reconstructing the deformation or temperature for the whole structure is a computationally expensive process. Therefore, we put a great effort into creating a platform where you can interact smoothly with the 3D data. MORe handles data visualization efficiently; becoming one of its great competitive advantages.
There are two cases where 3D data visualization is particularly important. The first case where the animation of the structure is essential is during the model development. When you are creating a new model of a machine tool you might ask yourself: “Why is this even happening, that does not really make sense?“. Only after animating the results, you realize that a definition of a link is wrong or that you applied the load to the wrong surface. Then it becomes obvious that 3D animation is key to ensure a correct model setup.
The second case where 3D animation of the results is important is during the interpretation of the results. During the analysis of your design, you might ask yourself: “Which axis is more sensitive to a change of environmental temperature? Which component leads to a tilt error motion at the TCP?” Only after looking at the animation of the results, you can get an answer to these questions and proceed with your next design iteration.
Let’s go back to the example with the machine tool exposed to a drop of the environmental temperature. Taking a closer look to the plot of the TCP displacements over time, we can see that the displacement in Z-direction reaches a maximum value of 18μm after 20 min. Afterwards, the displacement in Z-direction decreases to 12μm reaching a steady state. But why is this happening? Let’s take a look into the 3D animation of the results. The animation of the deformation shows that the difference between time constants of the axes lead to this response. The Z-axis reacts to the change of the environmental temperature within the first 20 min. The column and bed, which have a higher thermal inertia, react later to the temperature drop leading to a final steady state displacement of 12μm in Z-direction.
Once again, you are free to change the animation style as you prefer. For simulation results with thermal information, three different colormaps can be selected. The visibility or the representation of single components can be adapted, giving you the possibility to hide unimportant components. Changing the scaling of the deformation or set points (for transient mechanical simulations with controllers) is done in no time. In addition, you can change the information shown in the animation window.
Professional
You may ask: “How can I show these cool, colorful plots to my teammates in a PowerPoint presentation? Can I do any advanced postprocessing in Excel, MATLAB, or Python?”. But don’t worry, MORe’s got your back. Exporting simulation results using the postprocessor is quick and easy.
After you created a nice plot you can just click on save, which allows you to export the figure into several file-types, including .png, .jpg, .pdf or .svg and your MORe plot is ready for your presentation.
If you want to further analyze the data, MORe offers you the option to copy the table and paste the results in an Excel-file. Maybe you are MATLAB fan and you would like to do some custom postprocessing of MORe results. The postprocessor can also export the outputs in .mat-files that you can import into MATLAB or Python. Everything done in two clicks.
Even exporting animations in MORe is easy. Open the animation exporter, define duration and the number of frames per second of the video. The postprocessor exports the animation in a .mp4, .gif or .avi-file. There is no additional screen recording software necessary. The following video shows some of the possibilities of custom videos, showcasing different colormaps, hiding/showing components, and different surface representations.
Take-home message
The postprocessor of MORe is a powerful tool to analyze the simulation results created in MORe. You can use it to show the results in a plot or a table and customize the representation of the figures. Furthermore, you can animate the results of every simulation to increase the information you can get out of a simulation. If you prefer to plot the simulation results in Excel, MATLAB, or with custom Python scripts, you can easily export the data in no time. Exporting the created figures or animations is quick and gives that certain something your presentations need to convey the insights.