Static shape animator
Shows and animates the results of the frequnecy response analysis for a specific index. The index corresponds to the number of poses in the tabular static analysis definition. This animator is useful if for example the deformation at a specific index is important.
Figure panel
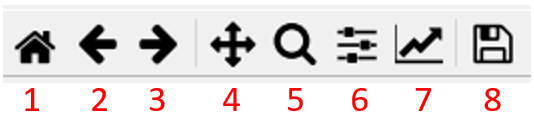
The panel can be used to customize the figure.
Number |
Function |
|---|---|
1 |
Reset the figure to the default view |
2 |
Undo the configuration step |
3 |
Redo the configuration step |
4 |
Move the region shown in the figure |
5 |
Zoom |
6 |
Define the general layout of the figure |
7 |
Change the style of display of the output data |
8 |
Save the figure |
Figure window
Shows the selected outputs.
Index
Select the index which should be displayed. The index corresponds to the poses in the tabular static analysis definition.
Show 3D scene
Open a new window where the deformations are animated.
Start animation
Start the animation of the selected mode.
Stop animation
Stop the animation of the selected mode.
Reset view
Reset the view of the animation figure.
Component visibility
Select the components that are shown in the animation window.
Format description
Change the description in the animation figure. The default description is given in the following table. Manual values can also be added.
Variable |
Description |
|---|---|
#simres_name |
Display the name of the simulation result |
#eval_name |
Display the name of the evaluation |
#viewer_name |
Display the name of the viewer |
#index |
Display the number of the index |
#scaling |
Display the scaling |
Outputs
Select the output links that should be displayed.
Configure selected output
Configure the selected output.
Output type
Select the type of the output.
Selected entity
Select the link that should be displayed.
Selected DOF
Select the degree of freedom that should be displayed.
Scaling
Scale the outputs.
Label
Define a specific label to the output.
Line configuration
Change the color, line style and line width of the line in the figure.
Add output
Add an output to the result output container.
Export outputs
Export the outputs to a matlab readable .mat file.
Export animation
Export the animation in to a movie.
Start rendering
Start the rendering of the movie.
End rendering
End the rendering of the movie.
Filename
Define the saving location and the filename of the movie.
FPS
Define the number of frames per second.
Duration
Define the duration of the movie.
Max/Min val
Define the start and end time of the simulation.
Start val
Define the start time of the simulation.
Clip height/width
Define the size of the movie window.
Export plot animation
Tick if in the figure should also be exported into an animation, in addition to the animation of the deformation.
Animation delay
Interval in milliseconds between two frames.
Fileformat
Define the format of the movie. The possible formats are mp4, avi and gif.
Actual value
Shows the progress of the movie rendering.
Number of samples
Define the number of steps between \(-\pi/2\) and \(\pi/2\) for the animation.
Animation delay
Interval in milliseconds between two frames.
Actual value
Define the progress of the animation with a value between \(-\pi/2\) and \(\pi/2\).
Scaling factor
Scale the deformation of the animation.
Autoscale |
Description |
|---|---|
Step |
Define a value with respect to the current step |
Total |
Define a value with respect to the total maximal deformation |
Manual |
Define a value manually |
Color map
Change the color map of a thermo-mechanical result.
Max/Min mode |
Description |
|---|---|
Step |
The max and min value are set corresponding to the lowest and highest temperature in the current index |
Total |
The max and min value are set corresponding to the overall lowest and highest temperature |
Manual |
Define the temperature range manually |