Figure viewer
Shows the simulation result in form of a figure.
Name
Shows the name of the viewer.
Load case
Select the load case that should be evaluated.
Figure panel
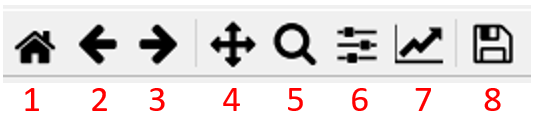
The panel can be used to customize the figure.
Number |
Function |
|---|---|
1 |
Reset the figure to the default view |
2 |
Undo the configuration step |
3 |
Redo the configuration step |
4 |
Move the region shown in the figure |
5 |
Zoom |
6 |
Define the general layout of the figure |
7 |
Change the style of display of the output data |
8 |
Save the figure |
Figure window
Shows the selected outputs.
X/Y scale
Change the scaling of the X and Y axis between linear and logarithmic.
Outputs
Select the output links that should be displayed.
Configure selected output
Configure the selected output.
Output type
Select the type of the output.
Selected entity
Select the link that should be displayed.
Selected DOF
Select the degree of freedom that should be displayed.
Scaling
Scale the outputs.
Label
Define a specific label to the output.
Line configuration
Change the color, line style and line width of the line in the figure.
Add output
Add an output to the result output container.
Export outputs
Export the outputs to a matlab readable .mat file.
Show in new figure
Open the figure in a new window.